Sentiment Analysis
The Sentiment Analysis feature in Omni monitors the emotional temperature of conversations in real time and consolidates customer perception indicators. The module organizes tracking into two areas: listening rule parameterization and visual dashboard monitoring.
How to Activate
To get started, you will need to:
1. Contact your CS so they can adjust the commercial conditions and processes in the Billings system.
2. The CS must open a ticket with Omni informing the Organization.
- 💡 Note: After this initial activation, new users can be added and linked to this profile normally through internal management, without the need for additional tickets.
Listening Profile Settings
The Listening Profile is the core engine of Sentiment Analysis in Omni. It determines the behavior of the intelligence engine when evaluating interactions, defining the sensitivity of scoring, which customer service channels will be monitored, and who should be alerted to critical emotional variations.
Through these rules, the operation can calibrate the sentiment thermometer according to the actual context of each queue, distinguishing, for example, the tone expected in a sales approach from what is acceptable in a collections or technical support channel.
Profile Management and Monitoring
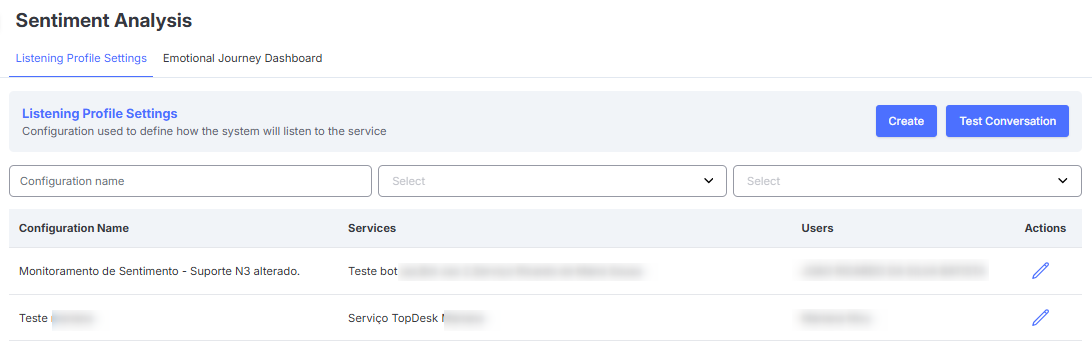
On the feature's home screen, the manager has access to a centralized dashboard of created rules, where they can register new guidelines, adjust active settings, and test the model.
The table displays the complete list of active profiles and their coverage across the operation:
Main Actions
- ➕ Create: Button located in the upper right corner to initiate the registration of a new listening profile for the operation.
- 🧪 Test Conversation: Interactive tool for quick validation, allowing you to paste sample dialogues to simulate the emotional score before applying the rule to production.
Search Filters
Above the list, three quick search fields are available to locate specific profiles within the operation:
- 🔍 Configuration name: Free text field to search for profiles by their registered title.
- 🎯 Service: Dropdown menu to filter rules linked to a specific queue or service.
- 👥 User: Selector to find configurations associated with a parameterized agent or supervisor.
List Columns
- 🏷️ Configuration Name: Identifier of the registered listening profile, facilitating quick association with its operational purpose.
- 🎯 Services: Indicates which Omni queues and services are actively being listened to and scored by this specific rule.
- 👥 Users: Lists the supervisors or analysts parameterized to receive alerts if interactions reach critical sentiment levels (or the Notification not enabled notice if alert sending is inactive).
- 🛠️ Actions (Edit): Allows opening the profile form to calibrate sentiment ranges, update limits, or modify linked services.
Profile Parameterization (NSR Ranges)
When creating or editing a profile, the manager has full flexibility to customize the sentiment index score ranges (NSR), adapting both the numerical limits and the visual identification colors according to the operation's strategy.
The scale ranges from -99 to 100, and the system automatically recalculates the intermediate limits as the minimum and maximum values are filled in.
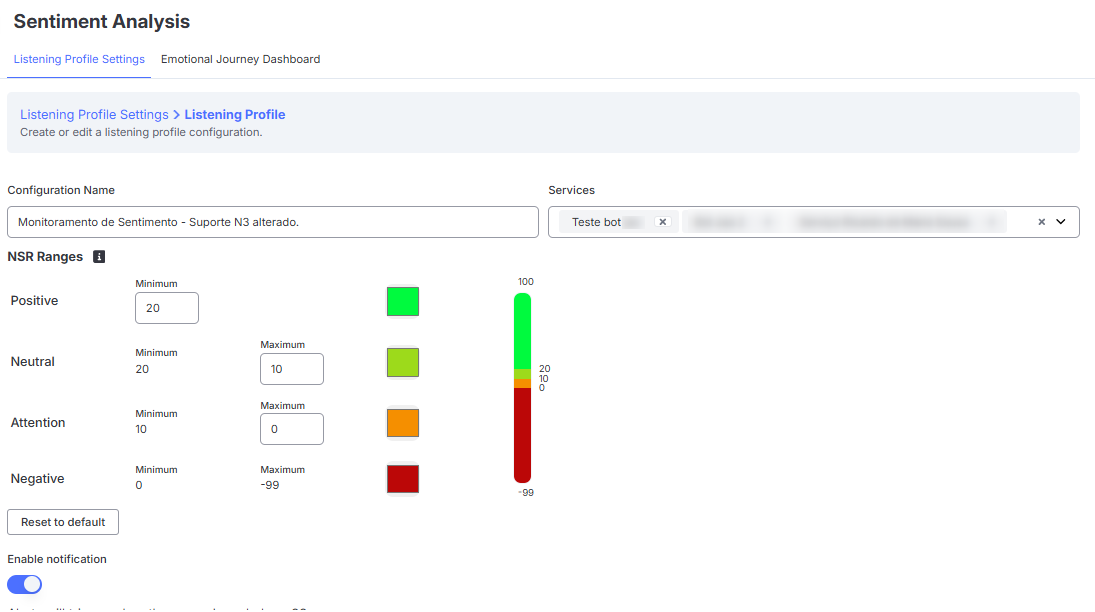
By factory default, Omni suggests the following reference distribution:
- 🟢 Positive (Default: Minimum 40 to 100): Represents interactions where the customer demonstrates high satisfaction, praise, warmth, or favorable outcomes. The color green signals healthy interactions.
- ⚪ Neutral (Default: 10 to 40): Intermediate range comprising purely operational, transactional, or informative dialogues, without evident emotional variations. Represented by the color gray.
- 🟡 Attention (Default: -10 to 10): Early warning range. Indicates moments when the customer expresses discomfort, persistent doubt, or hesitation, serving as a thermometer before potential friction. Represented by the color yellow/orange.
- 🔴 Negative (Default: -10 to -99): Critical range signaling explicit dissatisfaction, friction, severe complaints, or discontent with service or product. Represented by the color red.
Complementary Configuration Actions
- 🎨 Color Customization: You can click on the colored blocks next to each range to choose a customized palette that best fits your company's visual identity or internal dashboard standard.
- 🔄 Restore default: If manual calibration needs to be undone, this button instantly resets all ranges and colors to the system's recommended default scale.
- 🔔 Enable notification: Toggle switch that activates operational alerts to configured supervisors whenever a conversation reaches critical ranges of dissatisfaction.
NSR (Net Sentiment Rate) Calculation Methodology
The NSR (Net Sentiment Rate) is the core index that summarizes the emotional temperature of the conversation on a scale ranging from -100 to +100:
- Positive Values: Indicate customer service with favorable perception, cordiality, and satisfaction.
- Negative Values: Indicate moments of tension, critical doubt, friction, or explicit dissatisfaction.
- Values Close to Zero: Signal emotional stability, strictly operational dialogues, or a balance between neutral and mixed messages.
Algorithm Operation and Block Closing
To ensure efficiency and avoid overloading message-by-message processing in real time, the listening engine operates with a temporal intelligence window:
- ⏱️ Waiting Window (30 seconds): The algorithm waits for a 30-second inactivity interval after messages are sent or received to close the analysis block. This ensures that messages sent in rapid succession (such as broken sentences split across multiple lines) are evaluated together within the same emotional context.
💡 Consecutive Messages and Shared Score: When two or more messages are exchanged within the 30-second window, the listening engine processes them together in the same analysis block. On the timeline chart, each turn gets its own individual column to preserve the dialogue order, but all share the same NSR index calculated for that temporal package.
How Each Message is Evaluated
Whenever a block is processed, each message passes through the analysis engine, which returns four probabilities (values between 0 and 1 whose sum always equals 1):
| Component | Practical Meaning |
|---|---|
| Positive | Degree of probability that the message carries a favorable and satisfied tone. |
| Negative | Degree of probability that the message expresses a critical, tense, or unfavorable tone. |
| Neutral | Degree of probability that the message is purely informative or operational. |
| Mixed | Degree of probability that the message simultaneously blends positive and negative tones. |
💡 Impact of Neutral and Mixed Messages: The direct calculation of NSR considers solely the strength of Positive and Negative probabilities. Neutral or mixed components do not add points directly to the extremes, but function as dampers: the higher their presence, the more the total score is pulled toward the center (zero).
NSR Formula
For a set of N messages analyzed in a conversation, the system calculates the weighted averages and applies the official formula:
Positive Average = (Sum of Positive Probabilities) ÷ N
Negative Average = (Sum of Negative Probabilities) ÷ NNSR = (Positive Average - Negative Average) × 100
- If the service/interaction contains no evaluated messages (N = 0), the NSR is considered 0.
- The mathematical result will always remain within the range of -100 (fully negative) and +100 (fully positive).
Cumulative Behavior and Sentiment Shifts
The NSR does not reflect only the last message exchanged. With each new processed block, the system recalculates the entire accumulated history of the interaction from the start:
- No message is counted twice;
- If an interaction begins with strongly negative messages (heavily weighted close to -100), the index will require a proportionally higher volume of consecutive positive messages for the cumulative average to cross the threshold and turn positive (sentiment shift).
Three Scoring Views
The same mathematical formula is broken down into three independent perspectives to enrich the conversation audit:
| Indicator | Scope of Evaluated Messages |
|---|---|
| Overall NSR | Evaluates the entire set of messages exchanged in the interaction (Customer + Agent). |
| Customer NSR | Considers exclusively the messages sent by the customer throughout the contact. |
| Agent NSR | Evaluates the posture, warmth, and tone of the messages sent by the operator. |
Emotional Trajectory Dashboard
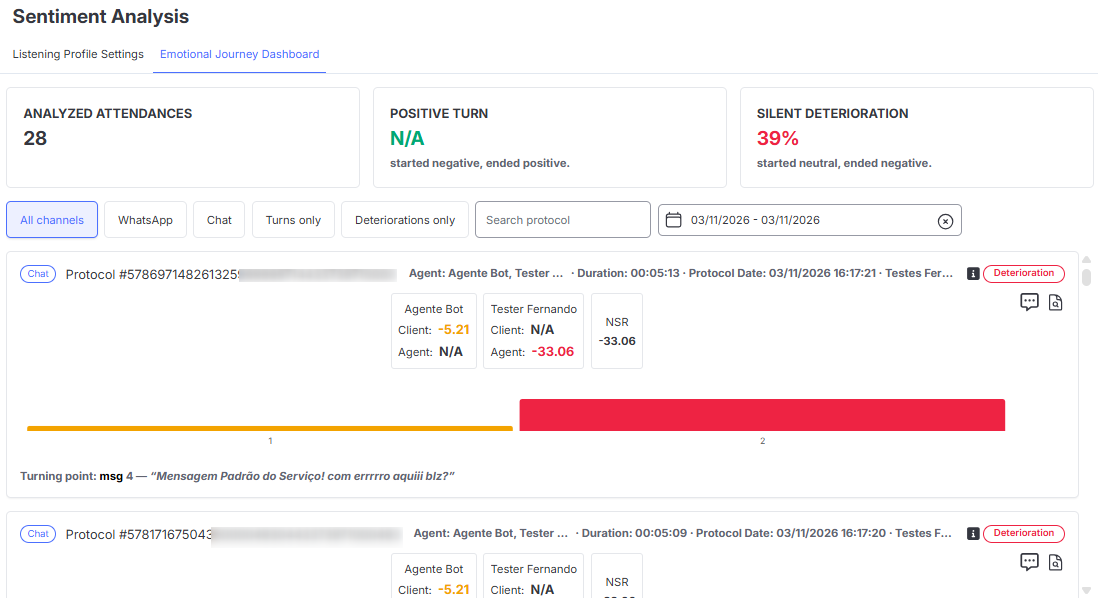
The Emotional Trajectory Dashboard transforms customer sentiment into a navigable visual map. Instead of summarizing an entire dialogue into a generic average, the panel tracks the evolution of mood message by message, allowing you to understand exactly how the conversation started, what changed along the way, and how it ended.
This visibility enables supervisors to perform targeted interventions, understand the impact of agent responses, and pinpoint with surgical precision the exact phrase where an interaction was turned around or entered into friction.
Key Metrics (Header Cards)
- 📊 Analyzed Interactions: Total volume of conversations processed by the engine within the selected filter.
- 📈 Positive Turnaround: Percentage and volume of interactions that started negative and ended positive following the agent's handling.
- 📉 Silent Deterioration: Percentage and volume of tickets that started neutral and ended negative, pointing to communication noise or friction during the interaction.
Search Filters
- 🌐 Channels: Quick filters by media (All channels, WhatsApp, Chat).
- 🎯 Behavior Filters: Exclusive view for Turnarounds only or Deteriorations only.
- 🔍 Search by Protocol: Specific query field to audit targeted interactions.
- 📅 Period: Selection of the analysis time window.
Interaction View and Timeline
Each analyzed ticket displays the complete emotional journey of the contact, combining registration data, evolutionary charts, and direct interaction auditing:
- 🎫 Ticket Header: Displays key interaction metadata: channel of origin (e.g., Chat, WhatsApp), protocol number, agents involved (including Bot Agent and human agents with transfer identification), total duration, contact date/time, and the linked service/queue.
- 🏷️ Overall Trajectory Classification: Badge located in the top right corner summarizing the overall emotional behavior of the conversation (e.g., Stable neutral, Stable mixed, Positive turnaround, Silent deterioration, or Unknown).
- ℹ️ Analysis Color Legend: Hovering over the info icon next to the classification reveals a floating panel showing the color palette applied to that service (whether the profile's custom rule or the factory default colors).
- 📊 Participant Scores and Consolidated NSR: Analytical panel with detailed scoring generated by the listening engine:
- Customer Score: Score calculated for messages sent by the customer across each stage of the interaction.
- Agent Score: Evaluation of the tone and warmth of responses provided by the operator.
- NSR (Net Sentiment Rate): Consolidated numerical index of the final interaction sentiment.
- 📉 Message Timeline (Trajectory): Sequential bar chart ordered chronologically (message 1, 2, 3...). Each bar represents a message turn and takes on the color corresponding to its sentiment range (positive, neutral, attention/mixed, or negative), allowing visualization of dissatisfaction peaks and moments of relief in the dialogue.
- 📍 Turning Point: Automatic highlight positioned below the chart identifying the message and exact excerpt where the conversation's sentiment shifted significantly.
- Negative Turnaround Example (Deterioration):
Turning point: msg 7 — "I am very disappointed with the delivery delay, this hurt me a lot." - Positive Turnaround Example:
Turning point: msg 9 — "Perfect! Thank you so much for the quick turnaround, everything is sorted now."
- Negative Turnaround Example (Deterioration):
- 💬 Interaction History: Message bubble icon that opens a modal with the complete transcript of the dialogue in chronological order (with option to sort oldest/newest) and an Export PDF button for external reporting.
- 📋 Satisfaction Survey: Document icon with a magnifying glass that opens the details window for the applied survey, listing each question sent to the customer alongside its assigned rating or response.
Bar Dynamics and Timeline Grouping
The column chart represents the sequence of interaction blocks throughout the conversation, mapping sentiment fluctuations at each stage of the service.
🤖 Bot Initial Grouping
When the interaction begins through an automated flow, the system does not create an isolated bar for each short response. Instead:
- All customer interactions during navigation with the bot are condensed into the first column (block 1) of the chart.
- This block receives a single consolidated NSR evaluation for the entire set of provided data (such as name, email, phone number, and menu options).
💬 Human Interactions and Transfer
From the moment the interaction is transferred to a human operator, new messages begin generating their own individual or sequential dialogue columns.
ℹ️ Block Numbering vs. Turning Point: The numbers displayed directly below the columns represent the chronological order of the conversation blocks (1, 2, 3...) and not the number of messages sent. Since all bot interactions are grouped into Block 1, if the bot dialogue consists of 5 messages and the customer vents in their first message after the human transfer (in Block 2), the system will display that bar in column 2, but will indicate in the lower text
Turning point: msg 6referring to the absolute message count.
🖱️ Hover Details (Tooltip)
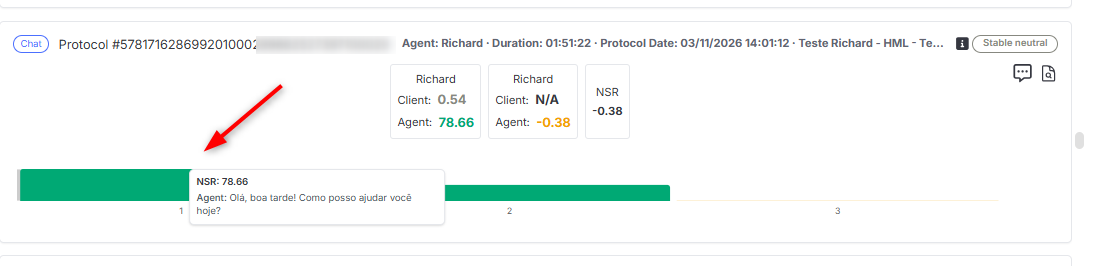
Hovering the cursor over any bar on the chart reveals an informational card detailing the exact moment of the interaction:
- NSR Score: The sentiment index calculated for that block (e.g.,
NSR: 3.91orNSR: -99.97). - Sender Identification: Clear label indicating the message origin (Bot, Customer, or Agent).
- Message Content: Transcript of the sent sentences, allowing you to audit the context without having to open the complete ticket transcript.
Sentiment Visualization in Operations
Sentiment classification is not limited to post-interaction reports; it is displayed in real time both for the agent during the dialogue and for supervision on the operational panel.
Sentiment on the Service Screen
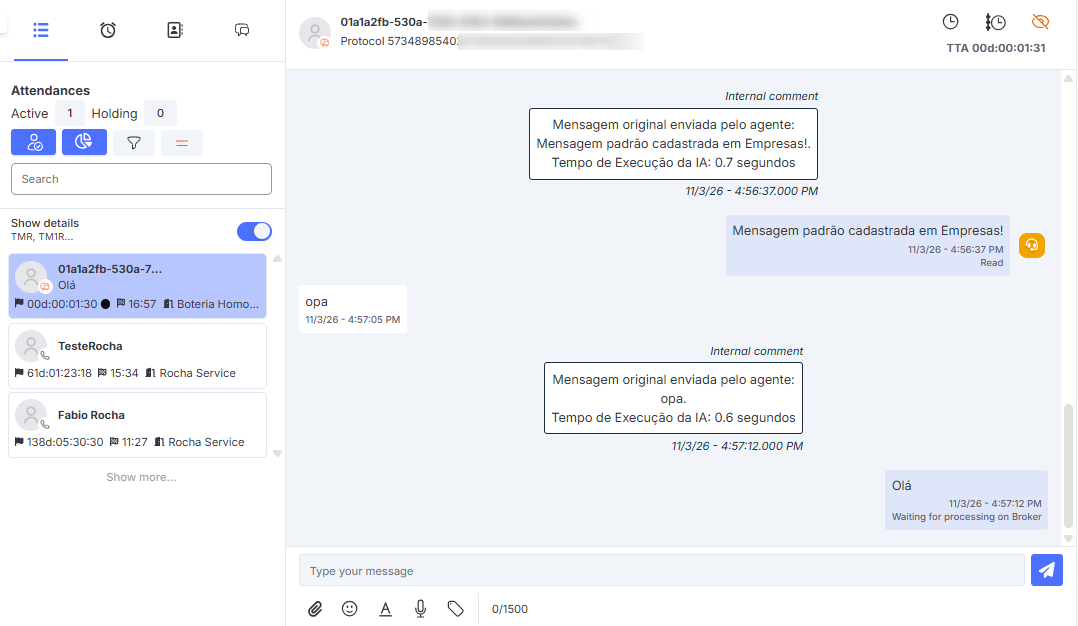
On the agent's chat screen, each message received from the customer features a colored headset badge indicating the calculated sentiment:
- 🎨 Color Accuracy: Badges strictly adopt the colors configured in the service's Listening Profile (Positive, Neutral, Attention, or Negative).
- 🖱️ Informational Tooltip: Hovering over the badge next to the message reveals a floating label with the corresponding nominal classification (e.g., Positive, Neutral, Attention, Negative).
- ⏱️ Automatic Refresh Window: Since the algorithm evaluates messages grouped into blocks after a 30-second inactivity interval, the sentiment badge is processed and dynamically loaded onto the screen as soon as the analysis is complete, without requiring you to refresh or reload the conversation view.
Sentiment in the Monitoring Dashboard
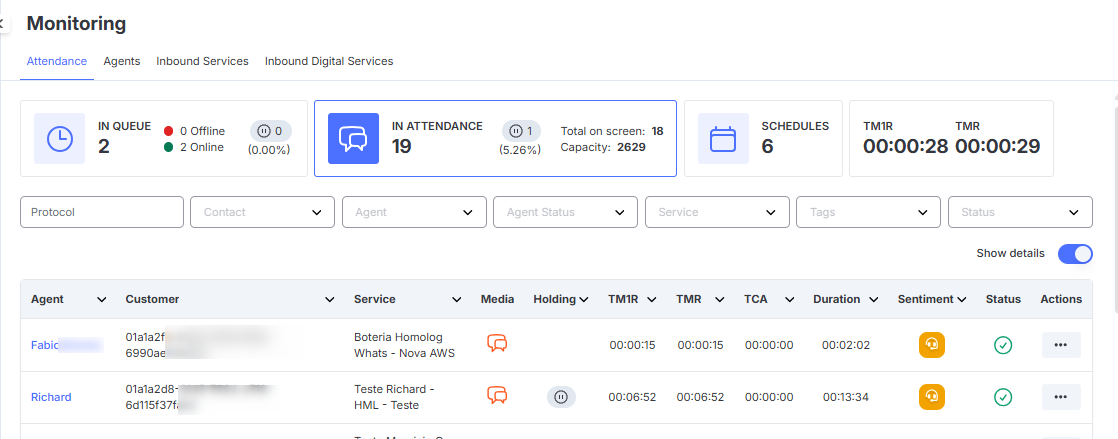
For managers and supervisors, the Sentiment column on the Monitoring screen (in "In Queue" and "In Progress" views) provides a bird's-eye view of the temperature of each ongoing interaction:
- 🚨 Quick Friction Identification: A colored circular icon displays the consolidated sentiment status of the conversation (e.g., red for negative, yellow for attention, green for positive) based on the sentiment classification calculated in the most recently analyzed block.
- 🎯 Proactive Intervention: Allows the supervisor to identify conversations experiencing deterioration or friction early in the dialogue, before a transfer to a human agent occurs or a formal complaint is filed, enabling immediate support for the operator.
Supervisor Alert Notifications
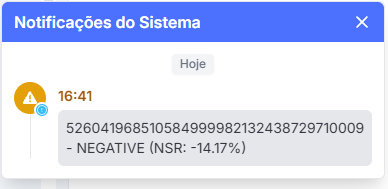
When the Enable notification parameter is active in the Listening Profile and assigned supervisors are linked, the platform issues proactive alerts directly in Omni's notification center as soon as an interaction reaches a critical range:
- 🔔 Immediate Trigger: As soon as the customer's message block closes and reaches the Negative range configured in the profile, a pop-up alert appears in the supervisor's System Notifications center.
- 📋 Alert Structure: The notification details the timestamp, the protocol number of the ongoing interaction, and the calculated classification alongside the exact accumulated NSR score (e.g.,
Protocol - NEGATIVE (NSR: -14.17%)). - ⚡ Quick Action: Shows the manager the situation right as it occurs so they can check the interaction in real time on the Monitoring screen, providing preventive assistance to the operator before friction escalates.
Sentiment in Interaction History
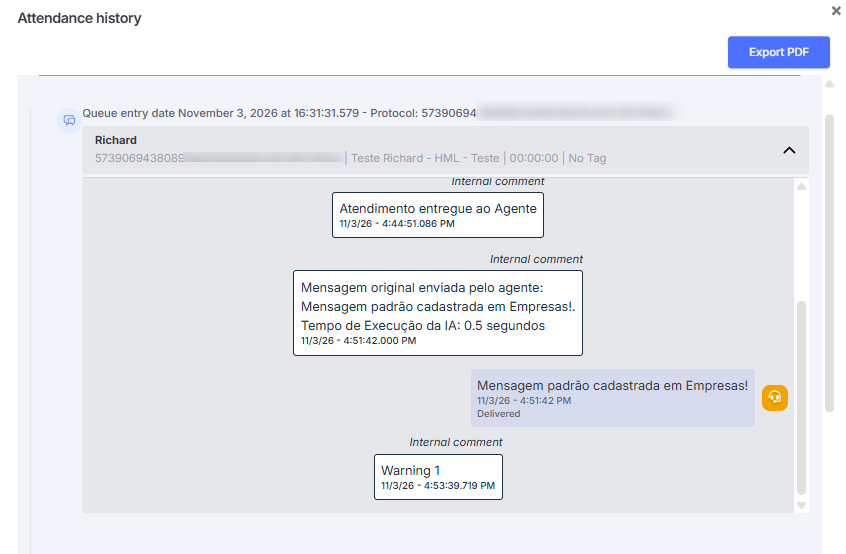
On the message history screen (accessed via Interaction Tracking or through the conversation history button), sentiment indicators are fully preserved:
- 🎧 Badge Display: Each message sent by the customer and the agent retains the colored headset icon corresponding to the sentiment range identified by the listening engine.
- 🎨 Visual Consistency: The applied colors strictly follow the same standard configured for the service and displayed to the agent during real-time interaction.
- 📝 Full Context: The view includes internal comments, delivery records, and agent or bot messages (if any), allowing you to audit the outcome of the conversation and understand the exact customer reactions at each stage of the interaction.
- 📄 Export: This entire structure can be documented externally using the Export PDF button located in the top right corner of the modal.
Data Export and Integration (Reports and APIs)
In addition to the on-screen visualization, consolidated sentiment indices and trajectory classifications are integrated into Omni's export files and reporting endpoints for external analysis:
📊 Available Fields
Whenever the service has an active and configured Listening Profile, the following metrics are included in the finalized records:
- Customer NSR: Sentiment index calculated based solely on messages sent by the customer.
- Agent NSR: Sentiment index evaluated from human operator responses.
- Interaction NSR: Consolidated final NSR score for the entire interaction.
- Result: Overall emotional trajectory classification for the contact (e.g., Positive turnaround, Silent deterioration, Stable neutral, Stable mixed).
📁 CSV Reports
The NSR and classification fields now form part of the files generated across system exports:
- Interaction Tracking CSV
- Available in the tracking module by clicking Export CSV:
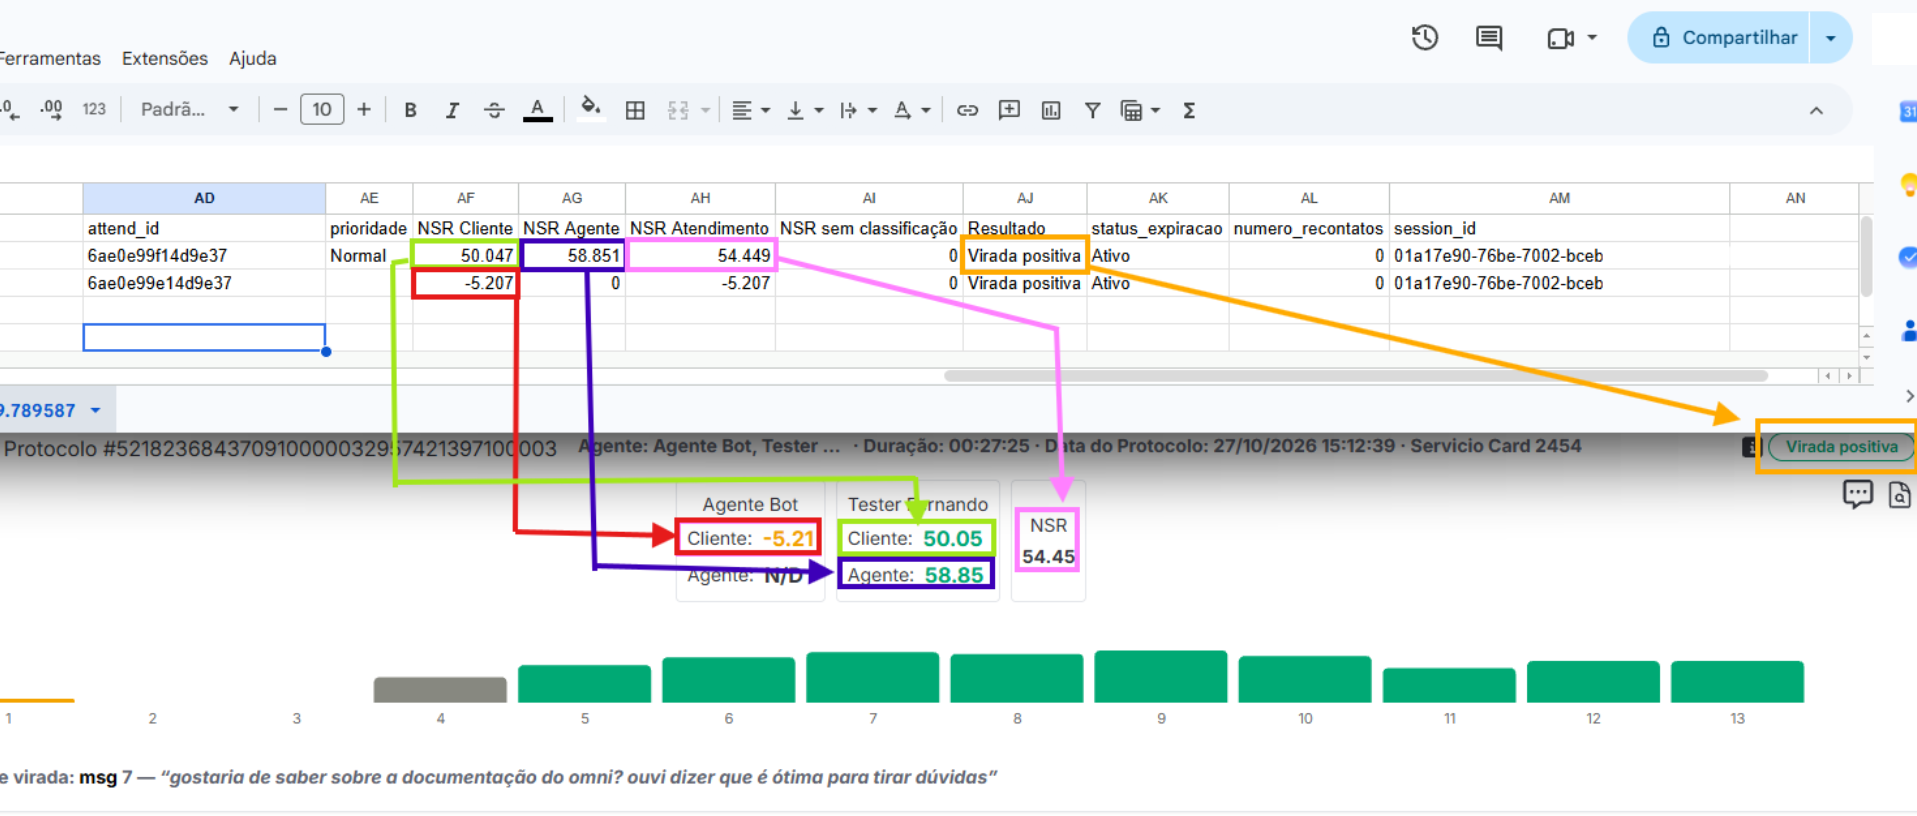
| On-Screen Field (Dashboard) | CSV Column (Tracking) |
|---|---|
| Customer (Human) | Customer NSR |
| Customer (Bot) | Customer NSR (Bot Row) |
| Agent | Agent NSR |
| Overall NSR | Interaction NSR |
| Classification Badge | Result |
ℹ️ Behavior in Transferred Interactions (Bot ➔ Human): In the tracking file, the automated stage and the human stage generate separate rows for the same ticket. The score regarding the interaction with the virtual assistant will appear in the
Customer NSRcolumn of the corresponding Bot row, while subsequent interactions will appear in the human interaction row.
-
Satisfaction Survey CSV
- Available in satisfaction survey exports, allowing you to correlate the rating assigned by the customer with the perception measured by the sentiment engine:
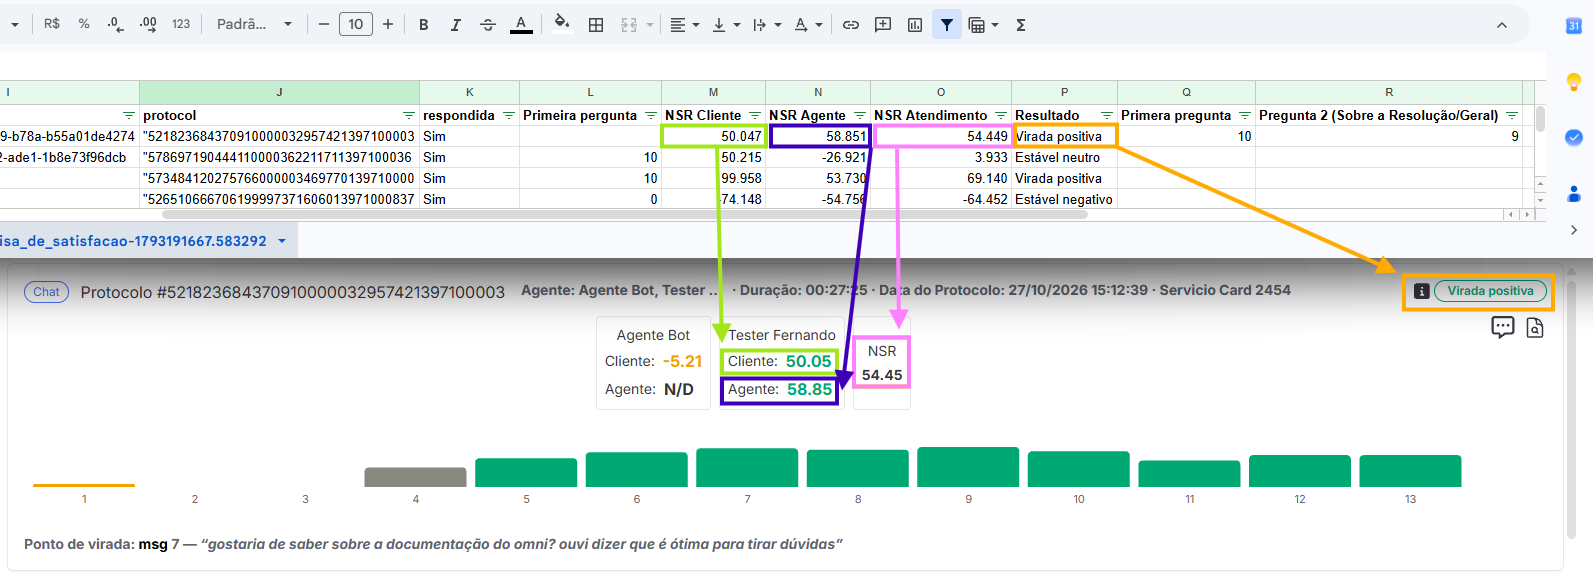
| On-Screen Field (Dashboard) | CSV Column (Survey) |
|---|---|
| Customer | Customer NSR |
| Agent | Agent NSR |
| Overall NSR | Interaction NSR |
| Classification Badge | Result |
🔌 API Integrations
For automated integrations and feeding external tools, the same indicators are mapped in the official history endpoints:
Covered Routes
- Service History API (
/reports/service_history/) - Survey History API (
/reports/satisfaction_survey_history_api/)
Field Mapping (Dashboard ➔ API)
The table below correlates the metrics visualized on the dashboard with the respective keys returned in request responses:
| On-Screen Field (Dashboard) | API Key (service_history / satisfaction_survey) |
|---|---|
| Customer | client_nsr |
| Agent | agent_nsr |
| Overall NSR | attendance_nsr |
| Classification Badge | journey |
ℹ️ API Technical Documentation: To view authentication parameters (API Key and Bearer Token), required headers, and complete request payloads for these routes, refer to the Omni API Documentation.